


State report card results show low-income students continue to perform far worse than wealthier counterparts
Lead Summary
By
Ohio Education Policy Institute-
The Ohio Education Policy Institute released the following statement Thursday following the Ohio Department of Education’s annual release of state report card data.
“Today’s state report card data shows that a disturbing pattern continues,” Dr. Howard Fleeter of the Ohio Education Policy Institute said. “Economically disadvantaged students continue to perform far worse than non-economically disadvantaged students on all measures. These results track with the recent study of the state’s school-funding efforts since the landmark Ohio Supreme Court DeRolph decision, which found disparities for low-wealth districts continue to exist two decades later.
[[In-content Ad]]
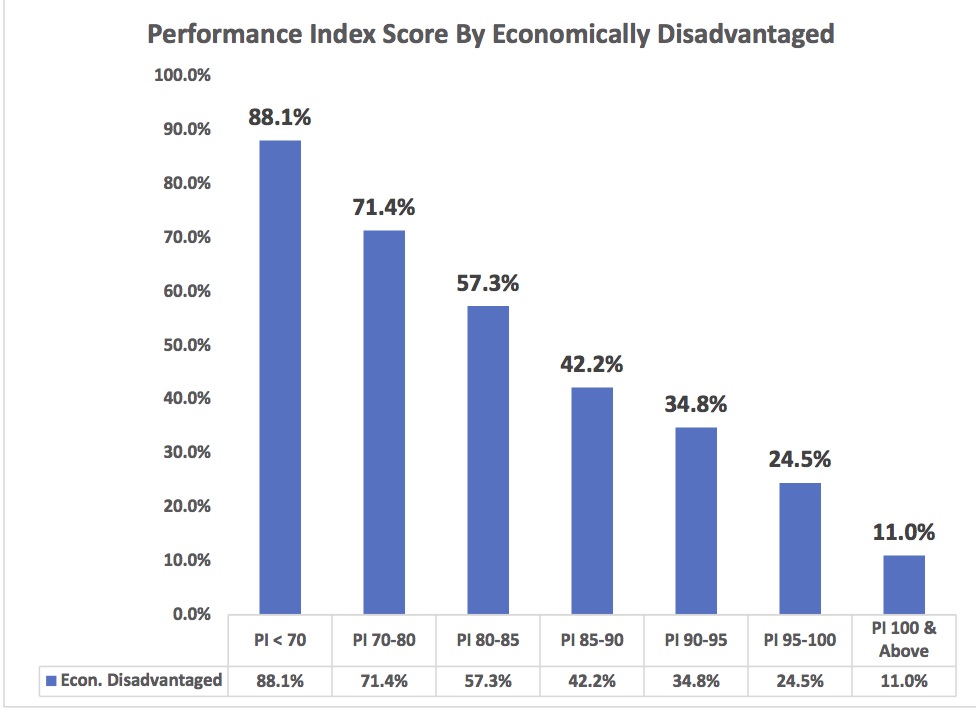
“Districts whose Performance Index is below 70 have an average of 88.1-percent economically disadvantaged students, and districts who performance index is above 100 have an average of only 11-percent economically disadvantaged students.”
“The Performance Index Score for Ohio’s lowest property wealth districts is 30-percent lower than the highest property wealth districts,” Fleeter added.
Last month, the Ohio Education Policy Institute released a report that showed the equity disparities among property wealth districts. A link to the report can be found by clicking here.
The Ohio Education Policy Institute will release a more detailed analysis of the report card next week.
The Performance Index measures the achievement of every student, not just whether they reach “proficient.” Districts and schools receive points for every student’s level of achievement. The higher the student’s level, the more points the school earns toward its index. This rewards districts and schools that improve the performance of highest- and lowest-performing students.
“Today’s state report card data shows that a disturbing pattern continues,” Dr. Howard Fleeter of the Ohio Education Policy Institute said. “Economically disadvantaged students continue to perform far worse than non-economically disadvantaged students on all measures. These results track with the recent study of the state’s school-funding efforts since the landmark Ohio Supreme Court DeRolph decision, which found disparities for low-wealth districts continue to exist two decades later.
[[In-content Ad]]
“Districts whose Performance Index is below 70 have an average of 88.1-percent economically disadvantaged students, and districts who performance index is above 100 have an average of only 11-percent economically disadvantaged students.”
“The Performance Index Score for Ohio’s lowest property wealth districts is 30-percent lower than the highest property wealth districts,” Fleeter added.
Last month, the Ohio Education Policy Institute released a report that showed the equity disparities among property wealth districts. A link to the report can be found by clicking here.
The Ohio Education Policy Institute will release a more detailed analysis of the report card next week.
The Performance Index measures the achievement of every student, not just whether they reach “proficient.” Districts and schools receive points for every student’s level of achievement. The higher the student’s level, the more points the school earns toward its index. This rewards districts and schools that improve the performance of highest- and lowest-performing students.